

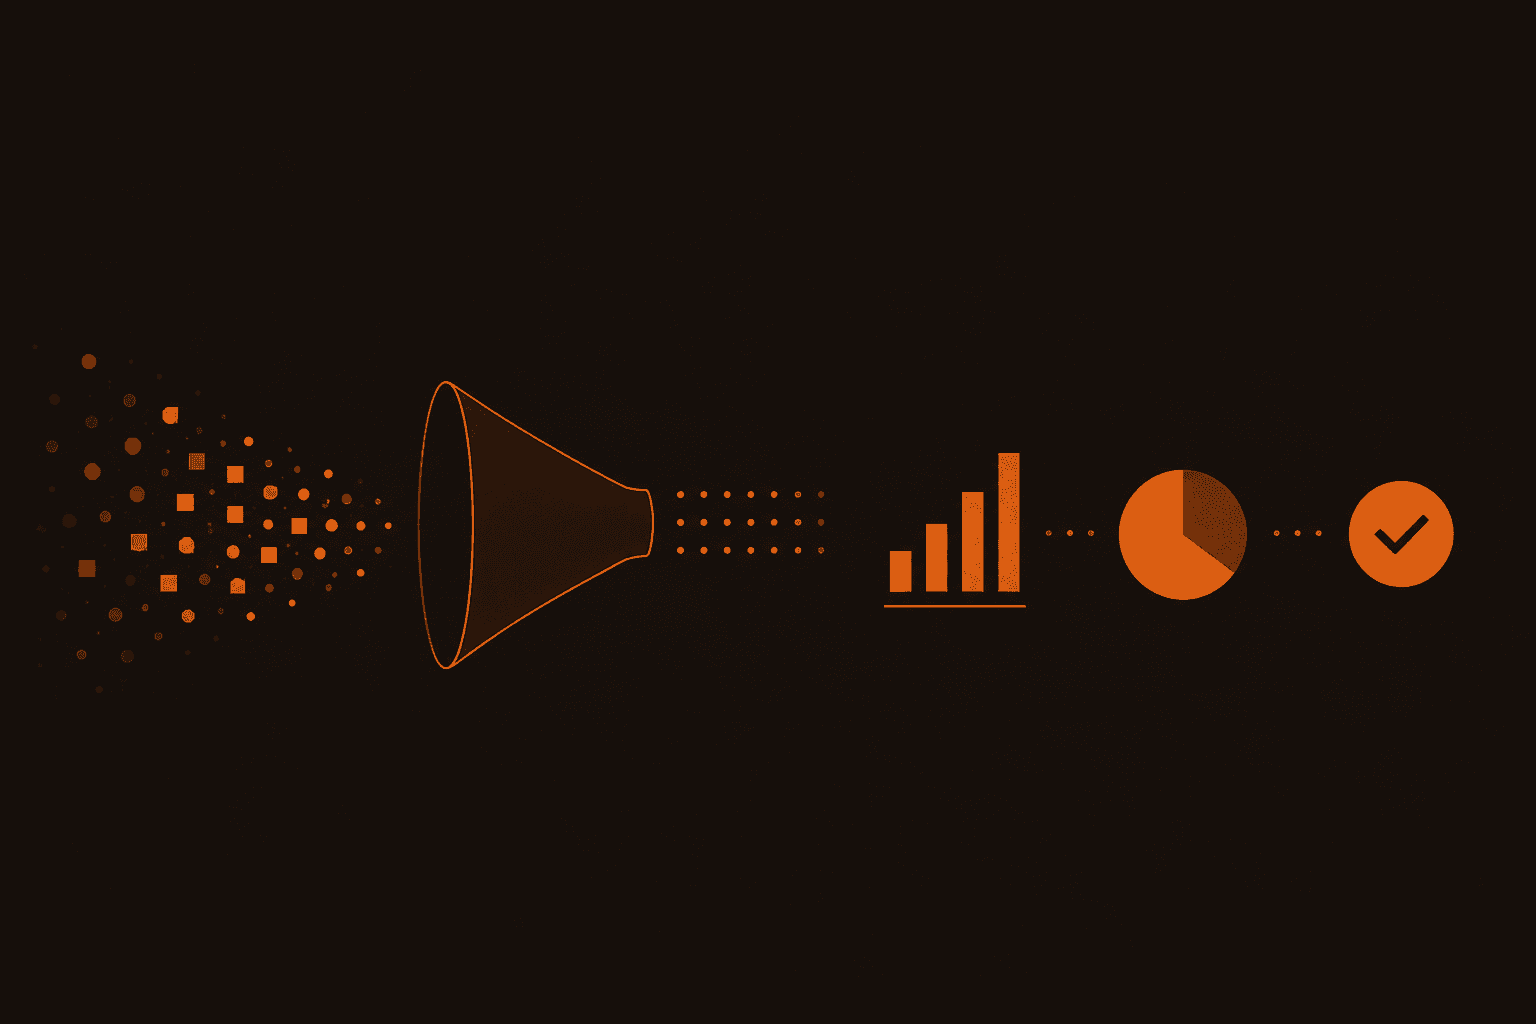
The discipline in brief:
Data analytics is the practice of extracting meaningful insight from raw data, an umbrella that covers the collection, organisation, storage, and examination of information, along with the statistical methods and software tools used to do so. Its central promise is deceptively simple: take what an organisation already knows, and use it to make better choices.
In practice, the field draws from computer programming, mathematics, and statistics, and it relies on a cluster of supporting techniques - data mining, data cleansing, data transformation, and data modelling - to ensure that analysis is rigorous rather than merely plausible. As businesses accumulate ever-larger pools of operational and customer data, analytics has become one of the primary levers for improving decision-making and driving measurable business results.
"The goal is never data for its own sake. It is clarity - the ability to see, with confidence, what happened, why it happened, and what is most likely to happen next."
The four types of analytics
Virtually every analytics project falls into one of four categories. They form a natural progression, moving from description toward prescription.
Type 1: Descriptive
What happened?
Uses historical and current data to describe the present or a past state, identifying trends and patterns. In business settings, this is the domain of business intelligence (BI) dashboards and standard reporting.
Type 2: Diagnostic
Why did it happen?
Drills into the output of descriptive analytics to identify root causes. If sales fell last quarter, diagnostic analytics investigates the contributing factors - channel mix, pricing, seasonality, and so on.
Type 3: Predictive
What is likely to happen?
Applies statistical modelling, forecasting, and machine learning to past data to generate probabilistic views of the future. Often classified as "advanced analytics," it frequently depends on ML or deep learning pipelines.
Type 4: Prescriptive
What should we do?
The most sophisticated tier. Uses testing, ML models, business rules, and algorithms to recommend specific courses of action that are most likely to deliver a desired outcome.
The four types are not mutually exclusive — mature analytics programmes typically operate across all four simultaneously, with descriptive and diagnostic work feeding the models that power predictive and prescriptive outputs.
Seven core analytical methods
Analysts reach for different statistical techniques depending on the nature of the question they are trying to answer. The seven most widely used are outlined below.
1. Regression analysis: A family of statistical processes used to estimate the relationships between variables, for example, understanding how changes in social media spend influence downstream revenue. It is arguably the most fundamental tool in the quantitative analyst's toolkit.
2. Monte Carlo simulation: A mathematical technique that uses repeated random sampling to model the probability of different outcomes in scenarios with uncertain inputs. Most commonly used in risk analysis and financial planning.
3. Factor analysis: A statistical method for reducing a large dataset to a smaller, more manageable set of underlying variables — useful for uncovering hidden patterns, such as the latent drivers of customer loyalty.
4. Cohort analysis: Breaks a dataset into groups sharing common characteristics (cohorts) and analyses each group separately. Particularly valuable for understanding how different segments of customers behave over time.
5. Cluster analysis: Classifies items into groups (clusters) by similarity, revealing structure in data that was not previously apparent. Insurance firms, for instance, use clustering to investigate why certain geographic areas generate particular claim patterns.
6. Time series analysis: Analyses data recorded at regular time intervals to identify trends, seasonality, and cycles. Weekly sales figures and quarterly revenue forecasts are classic use cases.
7. Sentiment analysis: The one qualitative method in this list. Combines natural language processing, text analysis, and computational linguistics to classify the emotional tone of unstructured data — such as how customers feel about a brand based on forum posts and reviews.
The analytics toolkit
No analyst works without software. The market for analytics tools spans open-source programming environments, cloud-native BI platforms, and specialised enterprise suites. Below are the most widely adopted.
The right tool depends on the team's technical depth, the volume of data involved, and whether the organisation favours cloud-native or on-premise infrastructure. Many enterprises combine several — for example, using Python or Spark for heavy data processing, Tableau or Power BI for visualisation, and a dedicated ETL tool such as Talend for pipeline management.
How data analytics relates to adjacent fields
The terminology in this space is frequently used loosely. The table below clarifies the meaningful distinctions.
Put simply: data analysis is one step in the analytics process; data science is where analytics feeds into broader research and modelling; and business analytics is the commercially focused application of those same techniques.
Analytics in practice: three case studies
Abstract definitions become meaningful when grounded in real decisions. The following examples show how organisations across very different industries have used analytics to solve concrete problems.
Fresenius Medical Care - Healthcare
Predicting life-threatening complications in dialysis patients
Fresenius, a specialist in kidney dialysis services, has pioneered the combination of near-real-time IoT sensor data and clinical records to predict a potentially fatal complication called intradialytic hypotension (IDH). By identifying at-risk patients before complications arise, the system allows clinical staff to intervene earlier — a clear example of predictive analytics with direct, measurable consequences for patient outcomes.
UPS - Logistics
Tracking 21 million packages a day with a single analytics platform
The multinational shipping company built the Harmonised Enterprise Analytics Tool (HEAT) to capture and analyse customer, operational, and planning data in real time. The platform gives UPS continuous visibility across every package moving through its network — roughly 21 million each day — and enables more responsive decision-making when disruptions occur.
Owens Corning - Manufacturing
Compressing 10 days of materials testing into two hours
With the support of its internal analytics centre of excellence, Owens Corning applied predictive analytics to the process of testing binders used in glass fabrics for wind turbine blades. The result was dramatic: testing time for any new material fell from approximately ten days to around two hours — illustrating the scale of efficiency gains available when analytics is embedded directly into engineering workflows.
The bottom line
Data analytics is no longer a specialist function confined to a back-office team of statisticians. It has become a strategic capability — one that shapes how businesses understand their customers, optimise their operations, and anticipate the future. Whether an organisation is trying to reduce patient risk, track global logistics, or accelerate materials testing, the underlying logic is the same: data, properly analysed, is a competitive advantage.
For professionals entering or advancing in the field, the combination of strong statistical grounding, fluency in modern analytics tools, and the ability to communicate findings to non-technical stakeholders remains the most durable and marketable skill set in the industry.